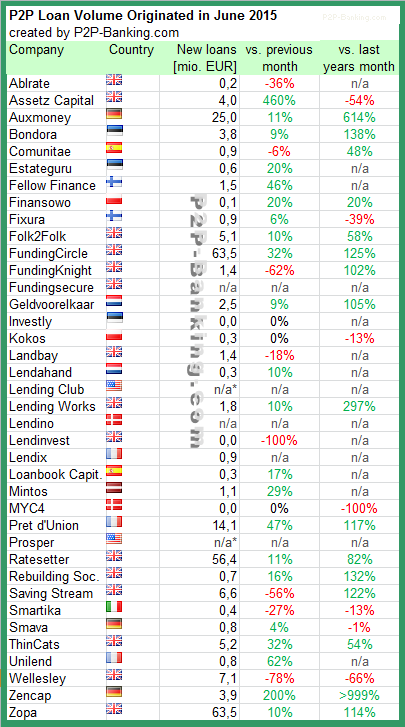
The following table lists the loan originations for June. Most p2p lending services grew in June. I do monitor development of p2p lending figures for many markets. Since I already have most of the data on file I can publish statistics on the monthly loan originations for selected p2p lending services.
Table: P2P Lending Volumes in June 2015. Source: own research Note that volumes have been converted from local currency to Euro for the sake of comparison. Some figures are estimates/approximations. *Prosper and Lending Club no longer publish origination data for the most recent monthNotice to p2p lending services not listed: Continue reading →
The following table lists the loan originations for May. The top four UK services volumes are close together, with Wellesley catching up. I added two new platforms. I do monitor development of p2p lending figures for many markets. Since I already have most of the data on file I can publish statistics on the monthly loan originations for selected p2p lending services.
Table: P2P Lending Volumes in May 2015. Source: own research Note that volumes have been converted from local currency to Euro for the sake of comparison. Some figures are estimates/approximations. *Prosper and Lending Club no longer publish origination data for the most recent month
In the chart below are the loan originations for April. I do monitor development of p2p lending figures for many markets. Since I already have most of the data on file I can publish statistics on the monthly loan originations for selected p2p lending services.
Table: P2P Lending Volumes in April 2015. Source: own research Note that volumes have been converted from local currency to Euro for the sake of comparison. Some figures are estimates/approximations. *Prosper and Lending Club no longer publish origination data for the most recent month
In March Lendinvest reported a surge in loan originations and had an exceptional month with more volume originated than Ratesetter or Funding Circle. I do monitor development of p2p lending figures for many markets. Since I already have most of the data on file I can publish statistics on the monthly loan originations for selected p2p lending services.
Table: P2P Lending Volumes in March 2015. Source: own research Note that volumes have been converted from local currency to Euro for the sake of comparison. Some figures are estimates/approximations. *Prosper and Lending Club no longer publish origination data for the most recent month
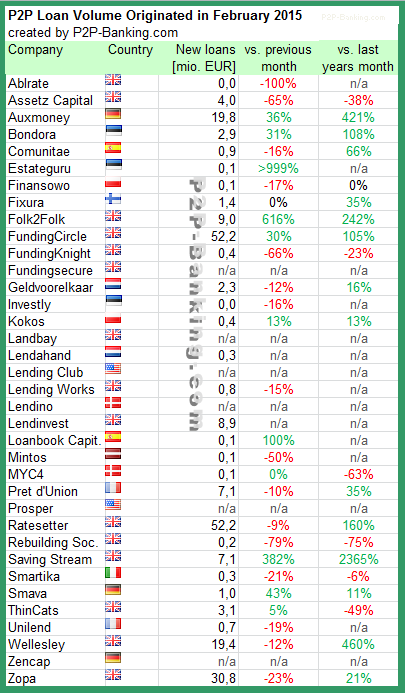
As February was a shorter month, loan originations fell compared to January with some exceptions. Ratesetter and Funding Circle are in a neck-and-neck race for largest volume figure this month. Prosper and Lending Club no longer publish origination data for the most recent month. I added two more services. I do monitor development of p2p lending figures for many markets. Since I already have most of the data on file I can publish statistics on the monthly loan originations for selected p2p lending services.
Table: P2P Lending Volumes in February 2015. Source: own research Note that volumes have been converted from local currency to Euro for the sake of comparison. Some figures are estimates/approximations.
Lending Club just announced the 4th quarter numbers in the investor conference call.
CEO Renauld Laplance stated: “We have continued to expand our reach through 2014 by doubling the size of the business again, while continuing to invest heavily in future growth and risk management. Our IPO in December was an important milestone in the life of the company, and everyone at Lending Club is excited about the next 5 to 10 years and committed to delivering more value and a great experience to our customers. 2015 is going to be another investment year, and we intend to continue growing originations and revenue at a fast, yet deliberate pace.”
Fourth Quarter 2014 Financial Highlights
Originations – Loan originations in the fourth quarter of 2014 were $1,415 million, compared to $698 million in the same period last year, an increase of 103% year-over-year. The Lending Club platform has facilitated loans totaling over $7.6 billion since inception.
Operating Revenue – Operating revenue in the fourth quarter of 2014 was $69.6 million, compared to $33.5 million in the same period last year, an increase of 108% year-over-year. Operating revenue as a percent of originations, known as our “revenue yield”, in the fourth quarter was 4.92%, up from 4.79% in the prior year.
Adjusted EBITDA(3)  – Adjusted EBITDA was $7.9 million in the fourth quarter of 2014, compared to $6.5 million in the same period last year.
Net Income/Loss– GAAP net loss was ($9.0) million for the fourth quarter of 2014, compared to a net income of $2.9 million in the same period last year. Lending Club’s GAAP net loss included $11.3 million of stock-based compensation expense during the fourth quarter of 2014.
Earnings (Loss) Per Share (EPS)Â – Basic and diluted loss per share was ($0.07) for the fourth quarter of 2014 compared to EPS of $0.00 in the same period last year.
Adjusted EPS(3)– Adjusted EPS was $0.01 for the fourth quarter of 2014 compared to $0.02 in the same period last year.
Cash and Cash Equivalents – As of December 31, 2014, cash and cash equivalents totaled $870 million, with no outstanding debt.
“We are entering 2015 with strong momentum on many fronts, and we intend to continue to execute on our strategy of fast yet disciplined growth,” said Carrie Dolan, CFO of Lending Club. “We will also continue to aggressively invest in product development, engineering, process automation, and the buildup of support and risk management functions to pave the way for our long term growth opportunity.”
Outlook
Based on the information available as of February 24, 2015, Lending Club provides the following outlook:
First Quarter 2015 Operating Revenues in the range of $74 million to $76 million. Adjusted EBITDA(3) in the range of $6 million to $9 million.
Fiscal Year 2015 Total Revenues in the range of $370 million to $380 million. Adjusted EBITDA(3) in the range of $33 million to $42 million
(3) Adjusted EBITDA and Adjusted EPS are non-GAAP financial measures
Strategy is to focus on the US market in the near future. There is no urgency to expand into international markets. There is not a lot of clarity which of the different models in particular geographies might prevail in customer adoption and get blessed by regulator.