Bondora Investments Using Decision Trees – Review of Progress – Part 6

This is part 5 of a series of guest posts by British Bondora p2p lending investor ‘ParisinGOC’. Please read part 1, part 2,  part 3 and part 4 and part 5 first.

Plan Your Change And Change Your Plan!

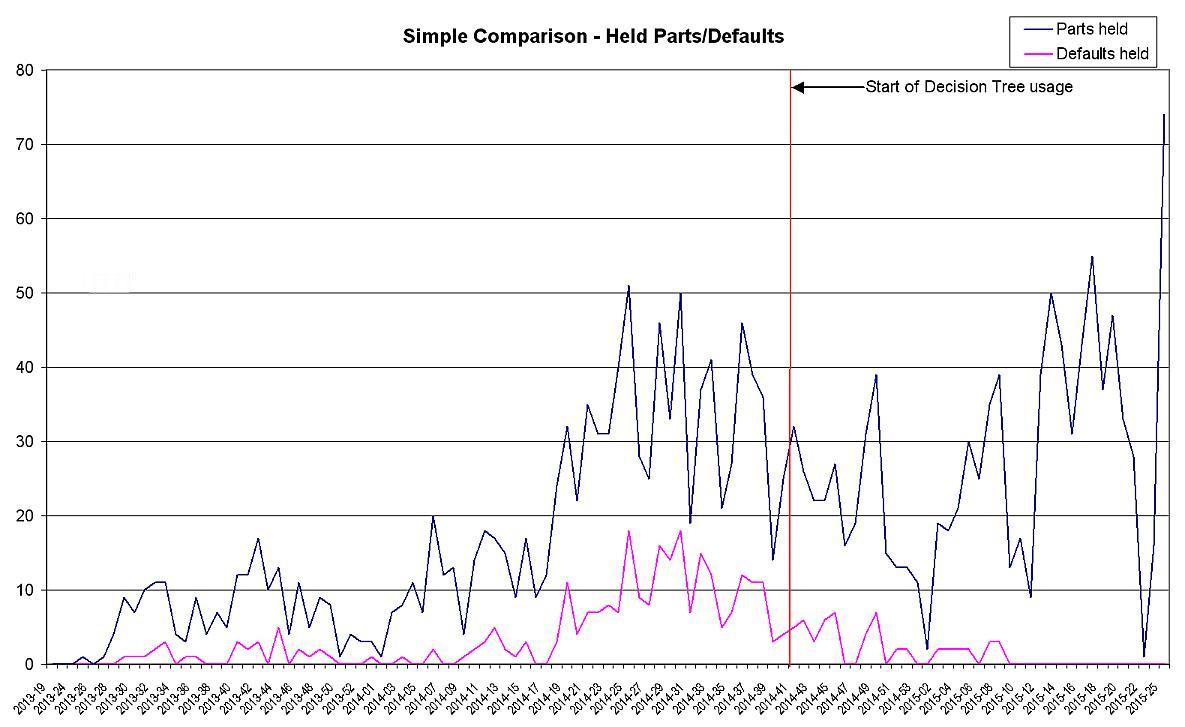
As stated in the previous article (see part 1-3) and revealed in the graphs of performance, I started using the Decision Trees in response to the rapid rise in defaults in my portfolio. Except for very small numbers of “opportunistic” purchases, I have maintained a strict discipline on purchase in order to ensure that my progress could be monitored and assessed. As my confidence has grown, I have modified this discipline to take advantage of the Bondora environment to achieve the demanding personal goals I had set myself when I first started. These included only purchasing Loan parts that should accrue 50% interest over the forecast life of the loan – i.e. should turn 5 Euro into 7.5 Euro over the original loan period.

Since early June, I have modified this discipline further and now purchase loans that, whilst still meeting my overarching rule of looking for 5% to 7% historical default levels, do not have a high enough interest rate to meet my earlier profitability goal. I intend to try and sell these loan parts on the Secondary Market with a short-term profit goal, after Purchase/Sale costs.

This further leg of my overall strategy is still in its infancy, but the results from my use of Decision Trees in my initial selection of Loan Applications suggest I am buying the best performing loans available. This means that should other investors not share this view, I will at least be left with Loan Parts that will perform well for me for the time I hold them.

Given the latest changes at Bondora mentioned earlier, if I can only acquire “good” (as defined by the Decision Tree analysis) from the Secondary Market, it may be that this buy-to-sell tactic may not be possible into the future.

Tree development

Tree Analysis

In the previous article (see part 1-3) on the construction of the Decision Trees, I explained how I had made adjustments to the overall analysis process to give more weight to factors such as “Total Income” in the actual Decision Tree analysis. I have kept the included data under constant Review and have added a few further fields to the analysis process, in particular the field showing the “Total Monthly Income/ New Repayment”. As stated in the first article, this needed to be modified from an infinitely variable value into 20 ranges, each of equal numbers of samples.

I mention this particular field as, since January 2015, it appears as an important feature in both the Estonia and Finland Trees and continues to appear more often in these Trees.

Volume and confidence

It is a fact that Estonia has been the largest market for Bondora from its days as Isepankur. In simple volume terms, the data I use (from 1/1/2013) shows that Estonia accounts for c.50% of the total loans, with Finland and Spain making up about 25% each. Slovakia is simply no longer mentioned in polite, Bondora society, so I will pretend it never happened!

Whilst it is true that Estonia has a lower historical default rate, in the dataset that I use, defaults do occur and are presently running at around 11.986% (1009 out of 8418), compared with exactly 18% (576 out of 3200) for Finland and 27.059% (1022 out of 3777) for Spain.

The above figures carry several implications as follows:

The Estonian Tree is fairly static with few changes at the highest levels. Estonian Loans within Bondora bring with them a richness in the data, by which I mean that the original Credit Scores are well represented across the Loan Applications compared to Finland and Spain, which are almost entirely populated with examples with a Credit Score of “1000”. What this means for Estonia is that the Decision Tree neatly shows that the Bondora Credit Score is relatively accurate, with higher numbers of defaults at lower Credit Scores. Thus it is that the historical record shows that Loan Applications with a Credit Score of “1000” (the highest and most sought after) make for good hunting when searching for segments having a default rate of less than 5%. Indeed, it is not uncommon for the Decision Trees to reveal segments of 50+ examples with NO defaults over the last 2.5 years.
Finland and Spain however, with very few historical Loan Applications with a Credit Score of anything other than “1000” combined with a default rate 50% and over 100% higher respectively than Estonia AND volumes less than half that of Estonia, provide pitifully few obvious segments with a sub-5% default rate AND sufficient numbers of examples to support anything like the confidence levels of Estonia.

I believe that the lack of richness in the Finnish and Spanish data is revealed in the overall structure of the different Trees.
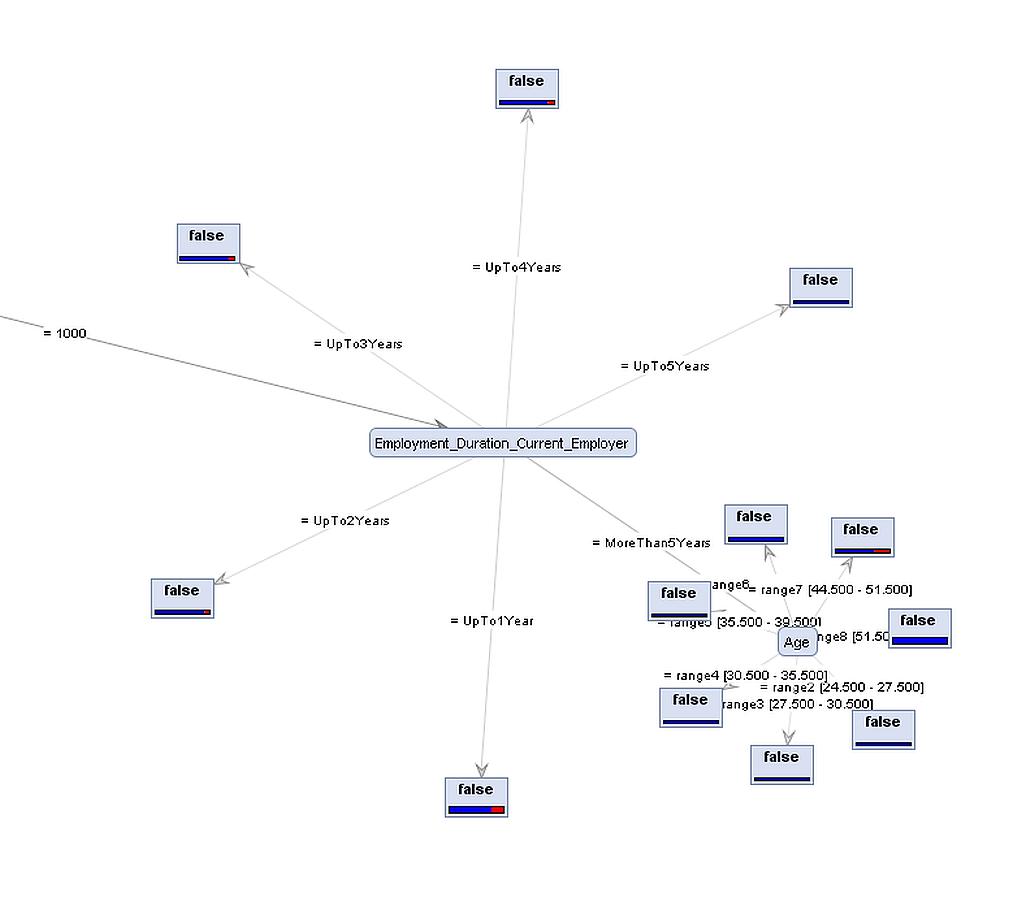
Estonia

The top-most branch in the Estonian Tree is based upon the Employment Status of Estonian Applicants. This represents 5 different values: Full Employment (c.90%), Entrepeneur (c.4%), Self-Employed, Retired and, finally, Partially Employed (these last at c.2%).

The Credit Score generally appears at the 2nd, 3rd or 4th level below this and, as stated above, provides a firm “fault line” between >5% and <5% default rates in most of the segmentation below these levels.
As noted earlier, for those in Full Employment initially Income and latterly the ratio of cost to income (which I refer to subsequently as “Affordability”) is the next most significant differentiator followed by Credit Score with the paths exhibiting differing significant data elements somewhat below this level.

A strange (in my eyes) feature of what I call “Affordability” that appears in the Estonian Tree for those in Full Employment is an apparent truth that the more someone can afford to cover the cost of the loan, the less likely they actually do so and the more likely it is that default will occur! 17.333% (65 out of 375) of those in Full Employment who appear to be most able to afford their loans go on to default whereas only 6.54% (24 out of 367) of those in Full Employment showing the lowest affordability have defaulted. So it seems that, in Estonia, the higher the ability to pay, the less likely this is to occur!

Finland

The lack of richness in the Credit Scores provided by Bondora for Finnish (and Spanish) Loan Applicants is revealed, as the Credit Score is the primary determinant at the top level. This is, however an almost totally useless determinant as just over 98% (just under 98% for Spain) of all Finnish Loan Applications carry a Credit Score of “1000”. Below this level, Employment Status is the prime determinant, as in Estonia, but there any resemblance ends as lacking the Credit Score and with lower overall volumes and there is no common thread to the analysis.

Latterly the ratio of cost to income (what I have termed “Affordability”) has crept in at lower levels but there is no pattern to be discerned and the Tree has not settled down to any pattern at the lower levels with changes occurring at all iterations.

Such are the problems with low volumes and high default rates that I have changed the parameters for the Decision Trees for Finland and Spain to force the analysis to work with higher volumes in the nodes and leafs (end points) in an attempt to increase confidence levels. This has the unfortunate side effect of there being few leafs with a sub-5% default rate, the notable exception being a leaf of 23 examples with a 0% default rate.

Spain

As noted above, Spain shares with Finland the feature of Credit Score and Employment Status being the top 2 levels but for Spanish Loan Applicants in Full Employment, the number of Dependants appears to be the most important factor and has remained so for over 6 months of analysis. This data element does appear occasionally in both other trees, but only at much lower levels.

Other than this notable difference, the overriding feature of the Spanish Decision Tree is the lack of leafs showing a sub-5% default rate. Even where sub-5% default rates can be found, there are so few examples in the set with little in the way of trend or discernable pattern to support confidence at any instinctive level.

The best sub-5% default rate is a leaf of 21 examples, being 4.75%, for fully employed, divorced people with 1 dependant living in Pre-Furnished property! All other leafs with a sub-5% default rate are based on less than 10 examples. Many are only single examples.

A competent statistician (which I am not!) may be able to pry some hidden gems from this Tree, but I fear not.

Conclusion

The Decision Trees themselves, whilst changing over time, now appear to have settled down and changes that occur do so at finer levels of granularity with only occasional changes in the overall structure of any particular tree.

The numbers of samples (the complete Bondora dataset) entering the process have now reached the level where the Trees for Finland and Spain required modification of the actual Decision Tree analysis (known as an “ID3” tree) to increase the sample sizes at the lowest level. This has increased my confidence in the output even though the levels of default are so high that identifying sub-5% default levels leave me rejecting many more Loan Applications than I actually invest in.

My initial, restricted purchasing at the start of my new strategy has opened out over the course of period under review. After an initial period where my cash reserves grew to over 25% of my initial investment at Bondora, I am now confidently pursuing new avenues of activity with a view to maximising my returns within the opportunities suggested by the Decision Tree analysis.

This success in using manual selection of investment opportunities comes in the face of constant change at Bondora, change that is trying to move the investment process towards a passive, easy-to-use activity – an understandable business logic.

I take some comfort that my total efforts to date (which include aggressive management of non-performing loans) appear to be returning better than average results. In conclusion, I believe that my change from instinct- to numbers-lead investing has improved my portfolio performance when measured by this admittedly coarse scale of default level. Furthermore, this process has allowed me to start to take a wider view of the opportunities available on the Bondora platform and I hope to be steering my returns back to the levels that initially drew me to this platform.
In terms of the performance over the past 9 months, I experience severely reduced default levels going forward compared to those that triggered my realisation that a new investment strategy had to be formulated. I am now seeing levels similar to those last observed almost 2 years ago, on purchasing volumes approximately double those from that time. I will be the first to admit that the loans purchased over the last 9 months have yet to “mature” to the level of those from nearly 2 years ago, but I have a renewed confidence in the future performance of my portfolio at Bondora.

P2P-Banking.com thanks the author for sharing his experiences and strategy in detail.

Back in March an investor from Luxembourgh wrote an article sharing his experiences in applying machine learning to peer-to-peer lending at Bondora.

Bondora Investments Using Decision Trees – Review of Progress – Part 5

This is part 5 of a series of guest posts by British Bondora p2p lending investor ‘ParisinGOC’. Please read part 1, part 2,  part 3 and part 4 first.

The Management of Change

As mentioned in my earlier article on the construction of the decision Trees, my responsibilities when employed (yes, dear reader, I am now retired) included the successful proposal to create new teams to conduct Data Mining and produce and disseminate Metrics relating to the research activities. As on many other occasions, I was then charged with making my assertions real by staffing and then running said teams to realise the benefits I had stated should arise.

As part of my (rapid) learning in these activities, I came to understand the need to maintain processes until solid analysis could isolate and support changes. So in this review period, for those elements under my control, I have maintained certain actions within set parameters until I felt I could justify a change and then have maintained that changed process until the next time the data supported a further change.

Changes I Controlled

Given that my need to change my selection process was as a direct of seeing my money rapidly disappear (!) I limited my ongoing expenditure to the minimum purchase (5 Euros) allowed by Bondora and only made 1 purchase per selected Loan Application.

This continued throughout October 2014, when I felt that the downward trend in parts falling behind with payments was established and likely to continue. From the beginning of November 2014 onwards I increased the number of parts of any single loan application I would buy to 2, still of 5 Euros each. Note that for some application types with, for example, a higher (between 5% to 7%) indicated historical failure rate, or a very high (above 45%) interest rate; I still limited my purchasing to 1 part of 5 Euros.

This Purchasing policy remained in place until the beginning of April 2015 when my increasing confidence in the selection process, my increasing cash reserve and other factors described below, meant I felt able to increase the value of purchases (to include 10 Euro parts if I felt an application was sufficiently strong) and increased the number parts purchased of any particular loan. This latter element in particular allowed me to take advantage of events outside of my control that offered opportunities that had not previously existed, explained later in this article.

Errors in my Process
In the period October 2014 to the end of the year, I was updating the Trees twice a month. There was no detailed timetable, but the Trees did exhibit a greater degree of change in this time than was later the case. It was during the first update in December, week 51 of 2014, I noticed that the previous Tree had been built using corrupted data. It was only later in the review period that I noticed that this period – from weeks 48 to 50 inclusive – exhibited the last “spike” in defaults.

From the next update onwards (31st December 2014) I implemented a more rigorous update procedure and restricted the updates to 1 at the end of each month. I felt that this may enable changes in the Tree Structures to be more visible and so attract my attention to these changes and validate the process that had generate them, thus avoiding process errors. The fact that the datasets provided by Bondora were subject change without notice (and did so often) was an additional factor in the decision to have fewer, more rigorous build events.

I worried that fewer updates to the Trees would lead to out-of-date trees and more In Debt and Defaulting loan parts, but this has not become apparent either in daily use or this review process.
I have noticed that the Decision Trees are not static and do change over time. Sometimes – rarely – these changes occur at a high level and are very noticeable. However, the Trees have changed in a subtle way at lower, more compartmentalised levels. This is discussed later in this article.

Changes I could not Control

Whilst I have tried to maintain a tight control over my activity since starting to use the Decision Trees to guide my loan selection, there is the overall Bondora environment over which I have no control. As noted in the previous article (see part 1-3), Bondora is a dynamic environment and changes, whilst usually signalled in advance, cannot usually be planned for and just have to be accommodated when the reality of the change becomes apparent. Where possible I have noted the changes that have occurred. As part of this review, I have gone back over the last 9 months activity to try and relate these changes and how I believe they have, or may have, affected my results.

Portfolio Manager
The Portfolio Manager in place up to the end of 2014 was an automated, parameter-driven mechanism to allow investors to automatically invest in loans that meet the criteria set by the investor. From the start of 2015, Bondora made major changes to the Portfolio Manager, preceded by allocating a “Risk Segment” (running from low to high risk) to each Loan Application.

Whilst a Loan Application retained the previous Credit Score and associated Credit Group (essentially an income-related grading), these no longer played a part in the new Portfolio Manager, which no longer allowed Loan Selection by any criteria other than the new “Risk Segment”. Probably the most contentious element of the new Portfolio Manager was the loss of selection by Country. The use of Country was a critical element in the previous automated selection process for most ( if not all) investors, and its loss was not well received on the official forum.

In terms of my process of Decision Tree analysis, this changed nothing. All the previous data was still present and some new data was added about the New Risk Segment and the process associated with it. I have considered adding the new Risk Segment data to the Decision Tree analysis, but decided against this primarily as its introduction, occurring as it did some 3 months into my experiment, had the potential to dramatically alter the structure of the Decision Trees, creating a possible disconnect at this point.

A secondary reason in my decision was the fact that this data was itself the result of an analysis conducted by Bondora and for which there is no detailed discussion or publication showing how it has been arrived at. Whilst I am not surprised at the decision not to publish what is, after all, company confidential data, the output – a legend consisting of a 1- or 2-letter classification – is not an independently verifiable fact, it is merely the output from an analysis and shares this feature with my own Decision Trees.

The major difference between this and the Decision Tree output I have is the context that is provided by a full Decision Tree to those who wish to use it. IMHO, the discerning viewer can decide from the context of a complete Decision Tree whether the end point of a particular branching of the tree indeed describes a trend or is just a convenient mathematical activity that segregates the data, but reveals no trend. I offer the snapshot of Self Employment from the Decision Tree for Estonia as an example of this added value.

Decision Tree View Estonia Bondora


To me, the bigger picture describes a trend suggesting that the longer the applicant has been in the same employment, the less likely a default will occur. It also shows that the Decision Tree has found that those in the same employment for over 5 years can be further segregated by age, with all defaults occurring in a single age range (45 to 51). Furthermore, the sample size of the >5 years employment is 51 and the defaults, which all occur in the noted age group, amount to just 2 examples – a 4% default rate on the set of 51 as a whole. Is this further segregation a guide to investment or just a “Clump” in a larger data set? In the words of the immortal Clint Eastwood “You’ve gotta ask yourself one question: “Do I feel lucky?Well, do ya, punk?”.

Application Process

In last half of February 2015, Bondora introduced changes to the application process designed to allow applications to be assessed by Investors before all data had been collected and, where applicable, validated.

This had no immediate effect on the Decision Tree analysis, but did require minor amendments to the process. Many applications were taking up to 5 or even 6 attempts before they became fully acceptable and finally funded. Many of these rejections took place after funding was in place. They were then cancelled and re-submitted with updated data. It was important that such applications did not get counted as “Previous Applications”. This field does appear in some lower levels in a Decision Tree and therefore new data cleaning activities (explained in the previous article) had to be introduced into the process.

Server Capacity Issues at Bondora

Around the 2nd week in March, 2015, the servers at Bondora ran into capacity issues. This affected both the ability of the applicant to apply for loans and for investors to lend.

Aggregated effect of Bondora changes

Concurrent with the introduction of the changed application process and the server capacity problems, it is apparent from a chart provided by Peerlan that the new Portfolio Manager’s ability to fund loans collapsed, effectively to zero.

Portfolio Manager Funding from Peerlan - 2015-06-23 snapshot

When Bondora fixed their capacity problems, the mix of Loan Applications becoming available to manual investors had changed dramatically. Whilst this had no effect on the use of Decision Trees to select loans, it meant that many more loans became available to manual bidders. Many of these loans were Estonian, historically considered to be of higher quality.

This availability of more loans of potentially higher quality is reflected in my activity by the highest level of loan part purchases seen since the start of my use of Decision Trees. This higher number of purchases occurred even with the restrictions I had placed on myself regarding the level of purchases per Loan Application, mentioned earlier.

As I write this review, the new Portfolio Manager process has again changed, this time to run more often, with a target of running effectively all the time. This new process appears to have a dramatic effect during the 16th July, reducing opportunities for manual bidding on new Loan Applications essentially to zero, as the new Portfolio Manager process swept up all new listings.

New Loan Applications have appeared again the next day and a close reading of the Bondora “Guide to Investing” FAQ suggests that Loans that fail to be filled immediately should appear out of the back of the new process and become available to manual investing and this appears to be the case. This occurrence and the availability of loans on the Secondary Market (at a premium in most cases), leaves me feeling that my work to date has not been in vain. Time will tell!

Flip forward to the final part 6.

Bondora Investments Using Decision Trees – Review of Progress – Part 4

This is part 4 of a series of guest posts by British Bondora p2p lending investor ‘ParisinGOC’. In part 1, part 2 and part 3 published in December 2014 you could read how he used the data to built decision trees to identify lending opportunities. Now you can read how that strategy worked out.

Introduction

In August 2014, I realised my portfolio of P2P loans at Bondora was not performing as I would wish. There was an urgent need to change the way I selected loans in which to invest the money I had at my disposal. My search for a better way of selecting loans lead me to use Decision Trees to analyse the loan data available from Bondora using “RapidMiner” – software available to download for free.

It is now over 6 months since I described my original work to construct the Trees. This follow-up article chronicles what I believe is the success of my efforts to date whilst also describing the multiple factors, both within and beyond my control, that mean that, whilst I feel very comfortable with the progress made to date, others may feel that I have just been lucky!

The journey since I created my first Decision Tree and started to make purchasing decisions based almost totally on their outputs has been one of constant change. Detailing the changes to elements over which I have no control has shown me how they contribute to what I believe is success as much as my own efforts to improve the selection processes. Describing the change in the Decision Trees as well as their use in the dynamic Bondora environment has left me feeling that, without constant monitoring and review of both the process of creating the Trees as well as their use, it may still be very easy to snatch defeat from the jaws of victory.

Key to ensuring the veracity of my protestations of success has been the maintenance of a consistent approach to my selection and lending process. To this end, I will describe those changes to my process that I can control and explain how and why such changes have taken place. In short, I have maintained a restricted buying policy, investing only the minimum amount (5 Euros) at any one time and, latterly, only buying a maximum of 2 loan parts (of 5 Euros each) in any one loan, depending on the outputs from the Decision Trees and my own mood at the moment of purchase.
I realise that this last phrase is not at all scientific, but the fact that my Portfolio of c.12000 Euros was not performing as expected was for me, a non-trivial affair and some emotional response has to be accommodated.

I have already stated that I believe my efforts have been successful. This is based on the fact that the rate of default (Once a loan principal has been overdue for 60+ days, it is labelled as “defaulted” – Bondora FAQ) in my portfolio has returned to historical, pre-2014 levels. Up to this time, even though I had come to realise that I needed to actively manage my portfolio, my selection of loans was done almost entirely using the “Portfolio Manager” – an automated, parameter-driven purchasing function provided by Bondora and supplemented by instinctual analysis of the descriptions of the Loan Applications available to invest in.

Simple Chart - Held Loans and Defaults


Looking at the simple chart of Held Parts/Defaults, the number of defaults in held loans rose significantly over the summer of 2014, coinciding with a big increase in both the number and value of investments on my part. Referring to the same chart, it can be seen that, even though the number of investments remains close to summer 2014 levels, my defaults have fallen to the numbers experienced earlier, at much lower volumes.

With my new-found confidence that I have a process for selection and management that appears to be sound, I have started to increase the volume of Loan Parts purchased so that the value is now approaching Summer 2014 levels of investment.

Progress to date

Graphical representation of Progress

I will use a more detailed graph showing the volume of Loan Parts purchased, those subsequently sold, those “Overdue” and those in default (still held by me as well as sold) to hopefully illustrate the performance of my selection and management processes. Continue reading

Decision Trees – Using The Available Data to Identify Lending Opportunities on Bondora – Part 3

This is part 3 of a guest post by British Bondora investor ‘ParisinGOC’.

Read part 1 and part 2 first.

Investments Decisions using the Tree(s)

Using the Data

Using the output is as simple as looking at the visualisation to see how the Decision Tree splits down from the Root Node and comparing this with a Bondora loan application that I see as a potential target for investment. (Illustration 2 and Illustration 3) At the end of the set of branches that I follow dependant upon the data in the loan application, I end up at a “leaf node”- the end of the tree. (Illustration 4)  This node simply states how many previous loans match the one I am looking at, showing how many of the previous loans defaulted and how many have not.

I treat the Decision Tree as the first step in choosing whether to invest. If the performance record of previous loans like the one I am now considering suggest a default rate of 5% or less, I look further into the loan application. Continue reading

Decision Trees – Using The Available Data to Identify Lending Opportunities on Bondora – Part 2

This is part 2 of a guest post by British Bondora investor ‘ParisinGOC’.

Read part 1 first.

Data Mining the Bondora data.

The initial process.

To help understand the specific data cleansing that the Bondora Data Set needed, I first made use of the RapidMiner metadata view – a summary of all the attributes presented to the software – showing Attribute name, type, statistics (dependant on type, includes the least occurring and most occurring values, the modal value and the average value), Range (min, max, quantity of each value for polynominal and text attributes) and, most critically, “Missings” and “Role”.

“Role” is the name given by RapidMiner to the special attributes that are needed to allow certain operations. In my case, the Decision Tree module needed to know which Attribute was the “Target”, that is the attribute that is the focus of the analysis and to which the Decision Tree has to relate the other attributes in its processing.  My “Target” was the “Default” attribute – a “Binominal” (called as such by RapidMiner and meaning an attribute with just 2 values) attribute – 1 if the loan had defaulted, 0 if not.

“Missings” is easy – this is the number of times this attribute has no valid value. For example, my import of the raw Bondora input data has 150 attributes.  Only half of these attributes have no missing values.  The remainder have between 13 and 19132 rows with missing values from a data set of 20767 rows.

To know whether these “missings” would impact my analysis, I needed to get to know the data in more detail.

I knew that Bondora had started to offer loans in Finland in summer 2013 with Spain following in October of that year and Slovakia in the first half of 2014.

I therefore decided not to bother with any loan issued prior to 2013. Continue reading

Decision Trees – Using The Available Data to Identify Lending Opportunities on Bondora – Part 1

This is a guest post by British Bondora investor ‘ParisinGOC’.

Introduction

Financial institutions across the world have many ways of assessing whether a loan is worth making.  A simple search on the web reveals that many use Data Mining.  More specifically, “Decision Trees” are a particular tool within Data Mining that has been analysed and I quickly found at least 2 papers (Mining Interesting Rules in Bank Loans Data and Assessing Loan Risks: A Data Mining Case Study) amongst many pointing in this direction.

Having had some experience of Data Mining in a financial environment, I believed I could use these same techniques in my own P2P lending which, after over 12 months activity, I felt could be improved.

In this document, I explore the use of the freely available Data Mining Software “RapidMiner” and its Decision Tree capabilities when applied to the data available to investors from Bondora, a peer-to-peer (P2P) lending site.

Bondora

Bondora is a P2P lending site based in Estonia that “unites investors and borrowers from all corners of the world”, allowing investors to invest funds to satisfy advertised borrowing needs.

Fundamentally, Bondora also provides comprehensive data to investors, allowing detailed data downloads of the individual loans held by the investor, as well as data on every application made to Bondora (originally known as Isepankur) since the first application on 21st February, 2009.

It is the complete Bondora data set that I have used as the raw data for analysis as it is the best data available to find out which potential borrowers are the right match to the potential lenders.  Only if enough lenders feel that a loan application is worth investing in will the loan be fulfilled.  Self-selection is taking place in both elements of the loan fulfilment and this data is the result of that interaction.

Also shown in this data are some elements of loan performance post-drawdown.  Crucially, it shows those loans that subsequently defaulted (failed to make any payments for a period in excess of 60 days).  Although Bondora will chase the debt on behalf of the investor and have a track record of some success, there is no guarantee that the investment, or any part of it, will be returned.

Decision Trees

www.investopedia.com/terms/d/decision-tree.asp states: A schematic tree-shaped diagram used to determine a course of action or show a statistical probability.

In this case, I am using the data provided by Bondora on all its previous applications to reveal how the resulting loans that share similar characteristics have performed.

Specifically, I am using this data to show the percentage of those previous loans that have defaulted and using this to indicate how a similar, new application may perform should the application succeed in attracting enough investors.

In other words, I am using past performance data to show how future investments may perform – I feel sure I have seen this phrase somewhere before! Continue reading